
Everything you need to make good calls in the field.
Eleven solutions, four categories: see what's happening, stay ahead of regulation, build long-term value, act with confidence. All connect through the same field record.
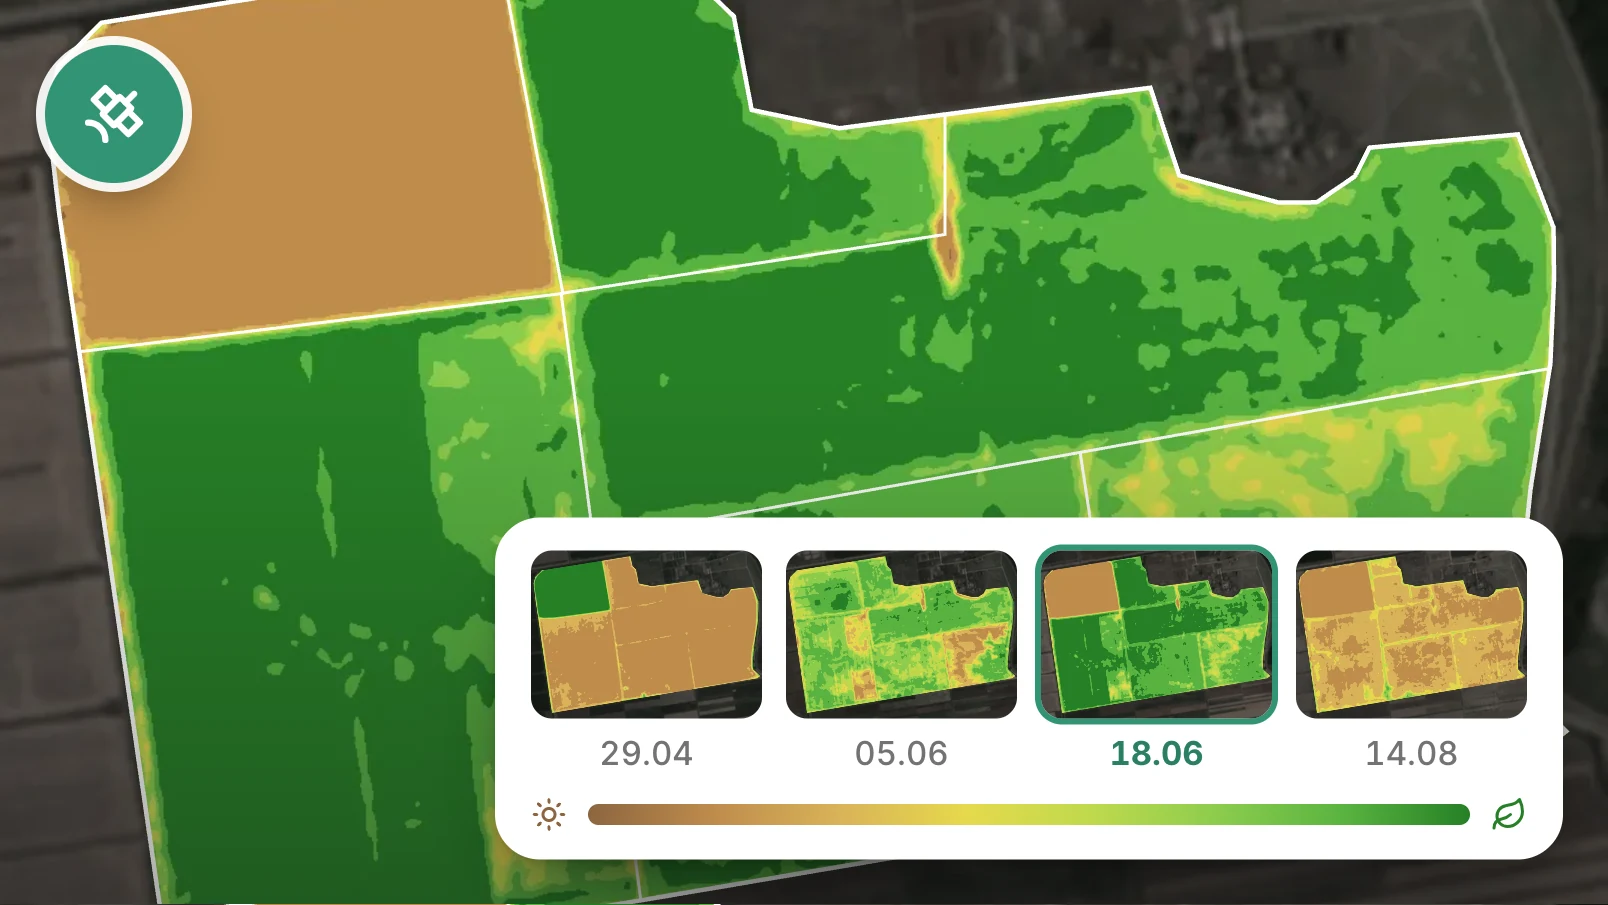
Satellite monitoring
Know what is happening on every parcel without walking it: new images every few days, anywhere in the world.
- See where the crop grows well and where it lags, on a colour map
- Find the zones where plants lack water, or where water sits
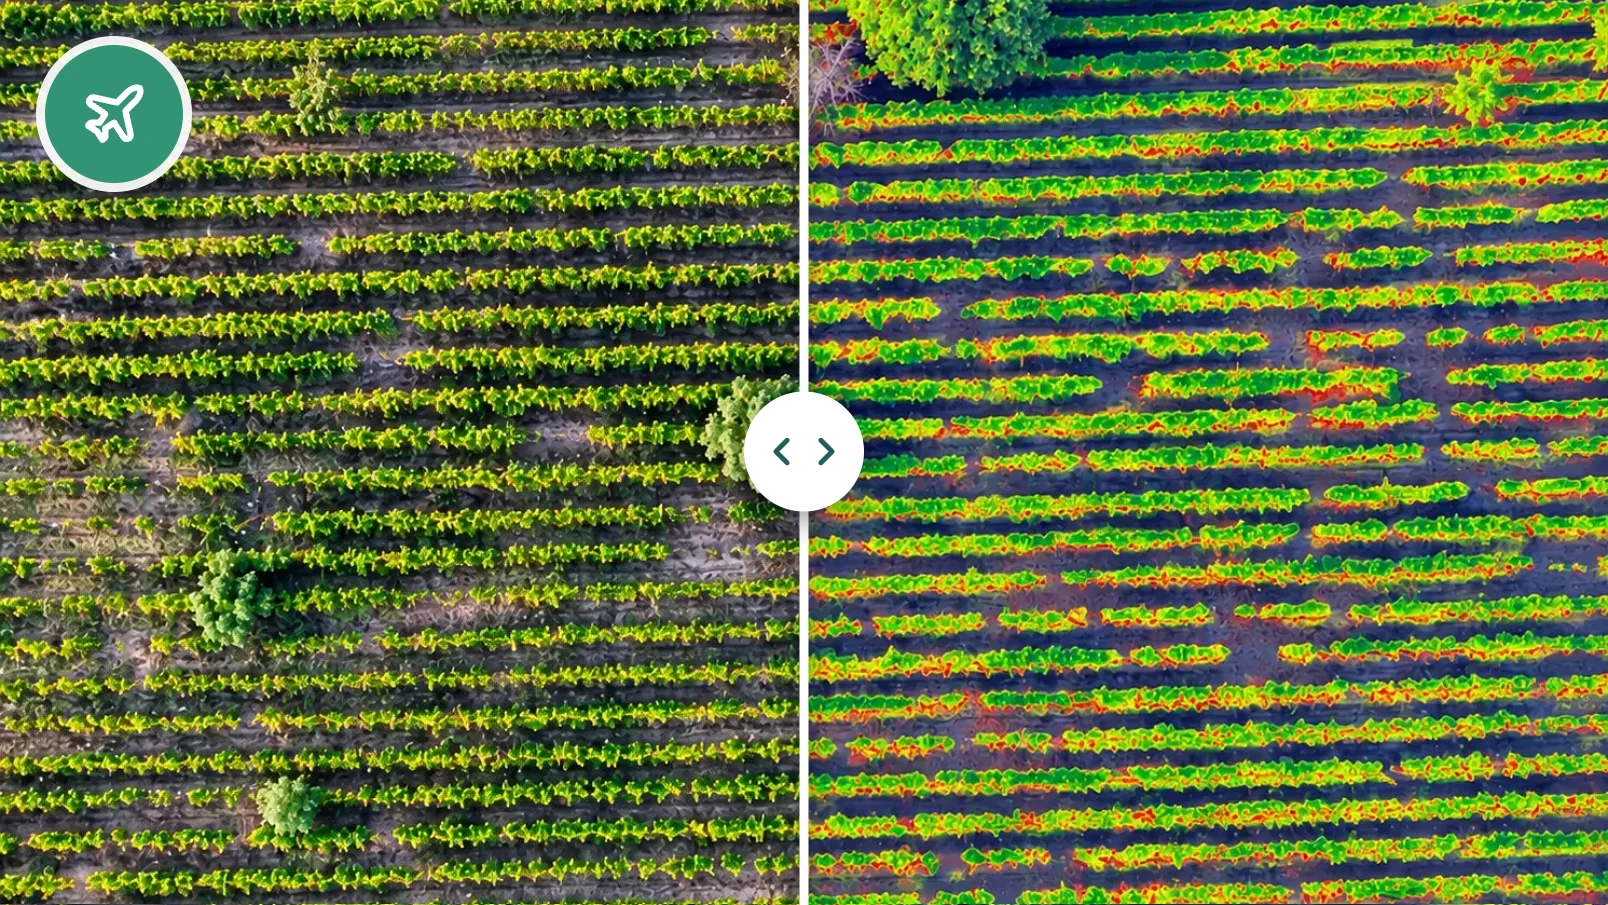
Drone surveys
Detail down to about 1 cm per pixel: every plant, every gap in the row, on your own parcel.
- See every plant: down to about 1 cm per pixel
- Count the plants and find the gaps in the row — maps made by our analysts
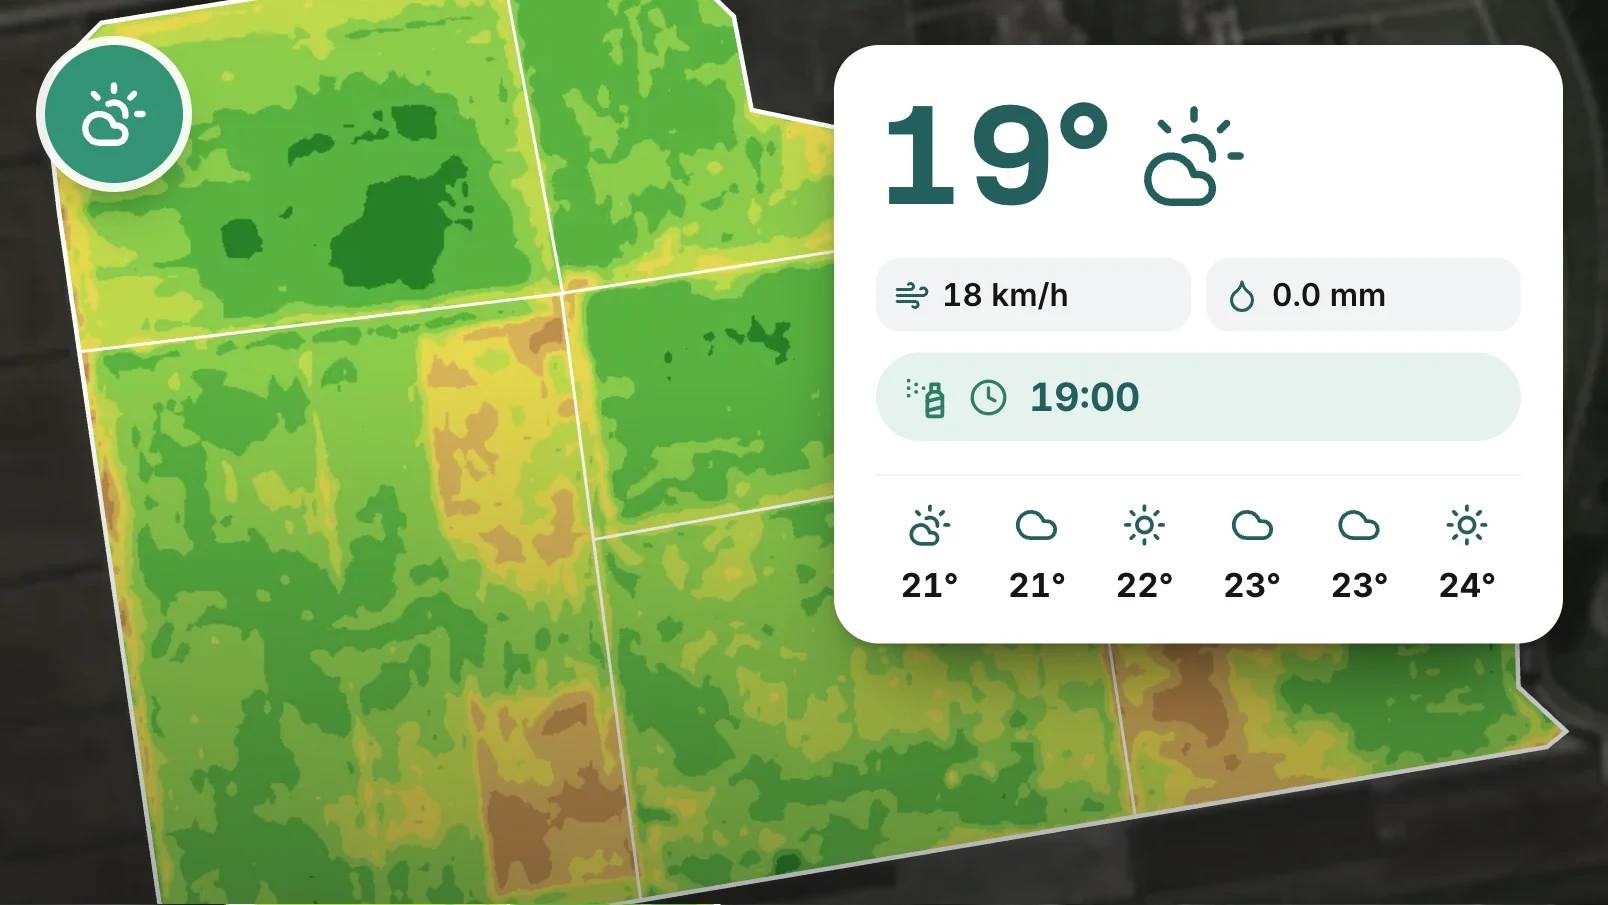
Weather monitoring
Know when to spray, sow or irrigate: your farm's 7-day forecast, and alerts for frost, heat or heavy rain.
- A virtual weather station for every farm — set the location, install nothing (Premium, Enterprise, or the weather module on Basic)
- Hour-by-hour forecast for 24 h and 7 days ahead: temperature, rain, wind, humidity
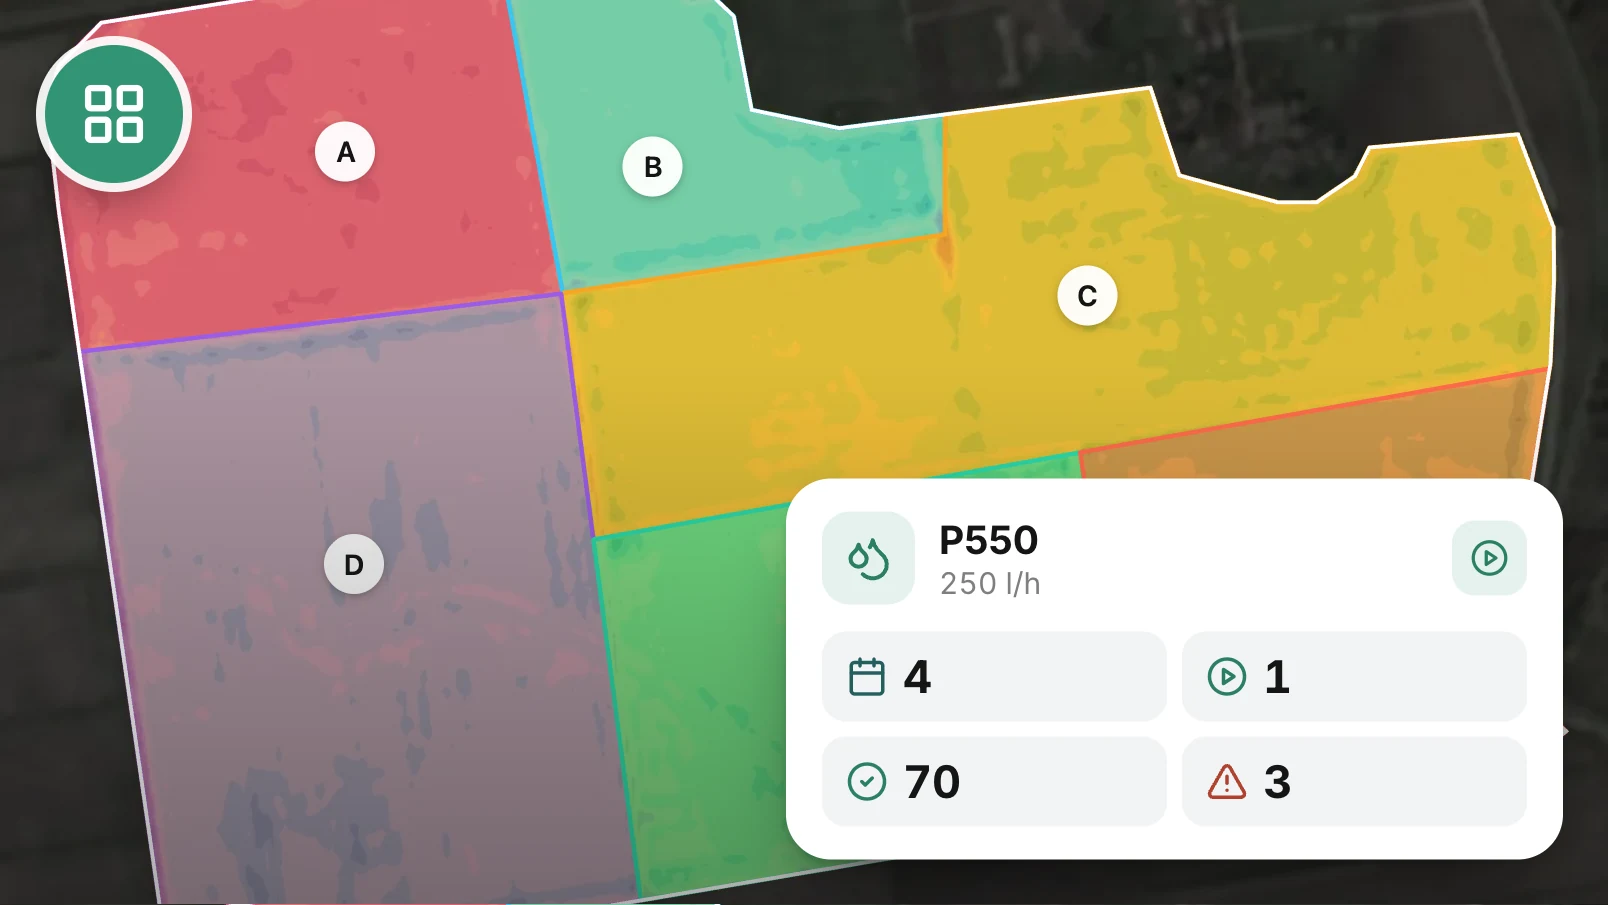
Farm management platform (FMS)
Your whole farm in one place: parcels, jobs, treatments and harvests, on the map and on your phone.
- See every parcel on the map, with its crop and its history over several years
- Record every job in the field: sowing, treatments, fertilising, harvest
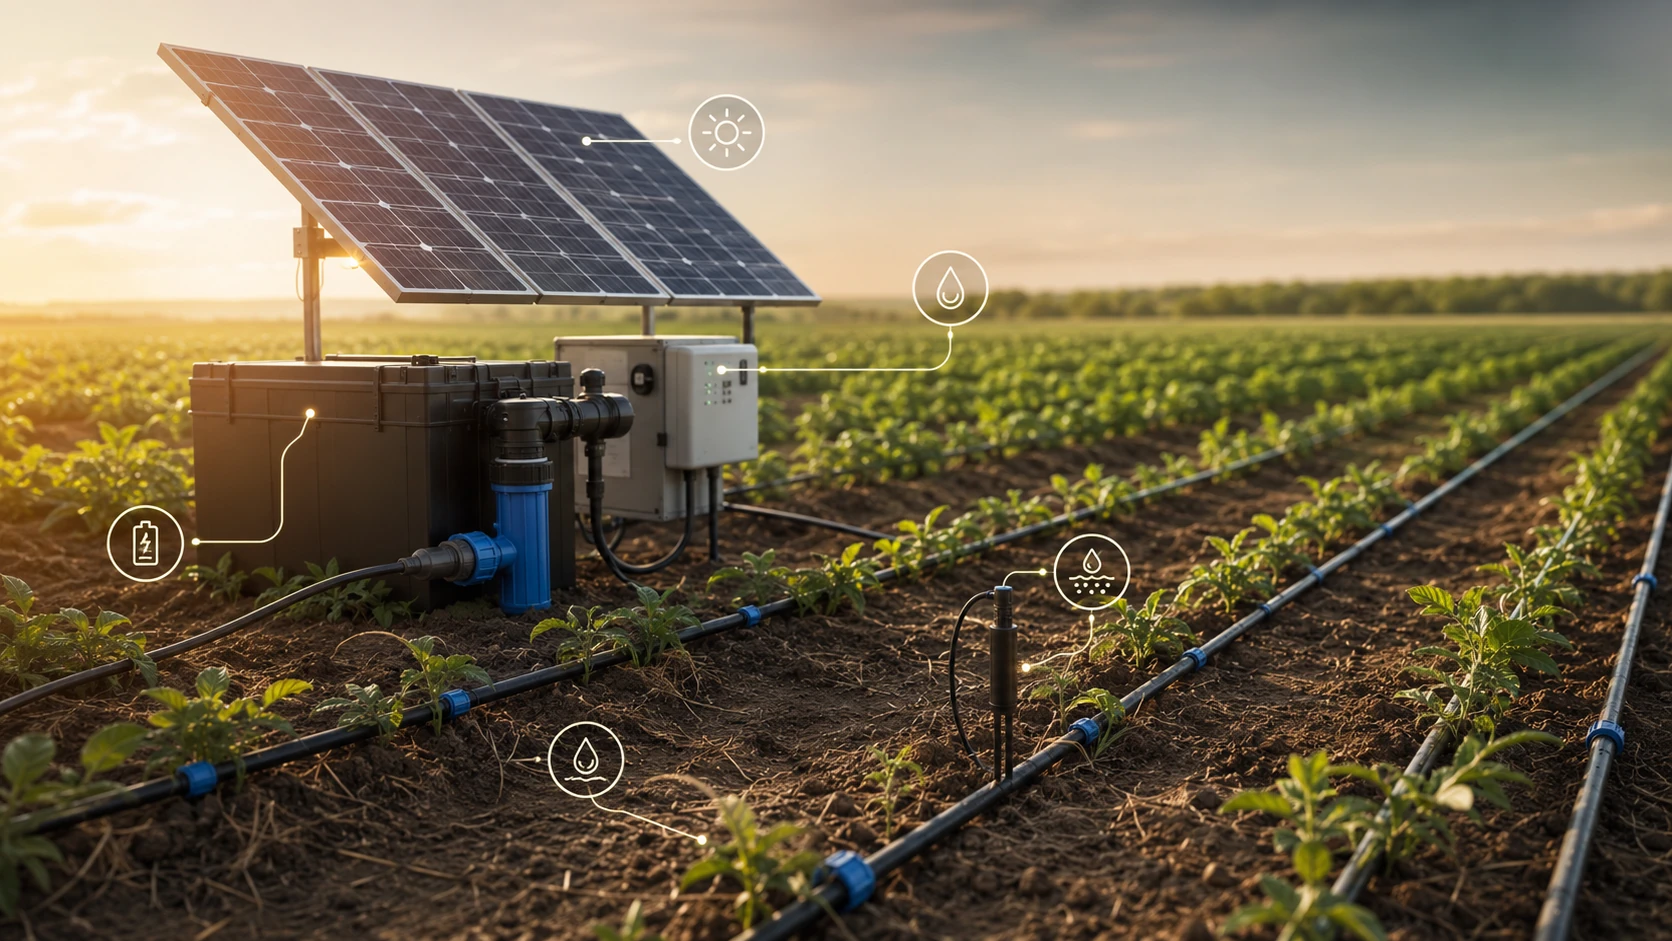
Drip-irrigation systems
Design, supply and installation of drip-irrigation systems — EU-funding ready.
- Automatic hydraulic sizing in the simulator
- Help with EU and national funding applications
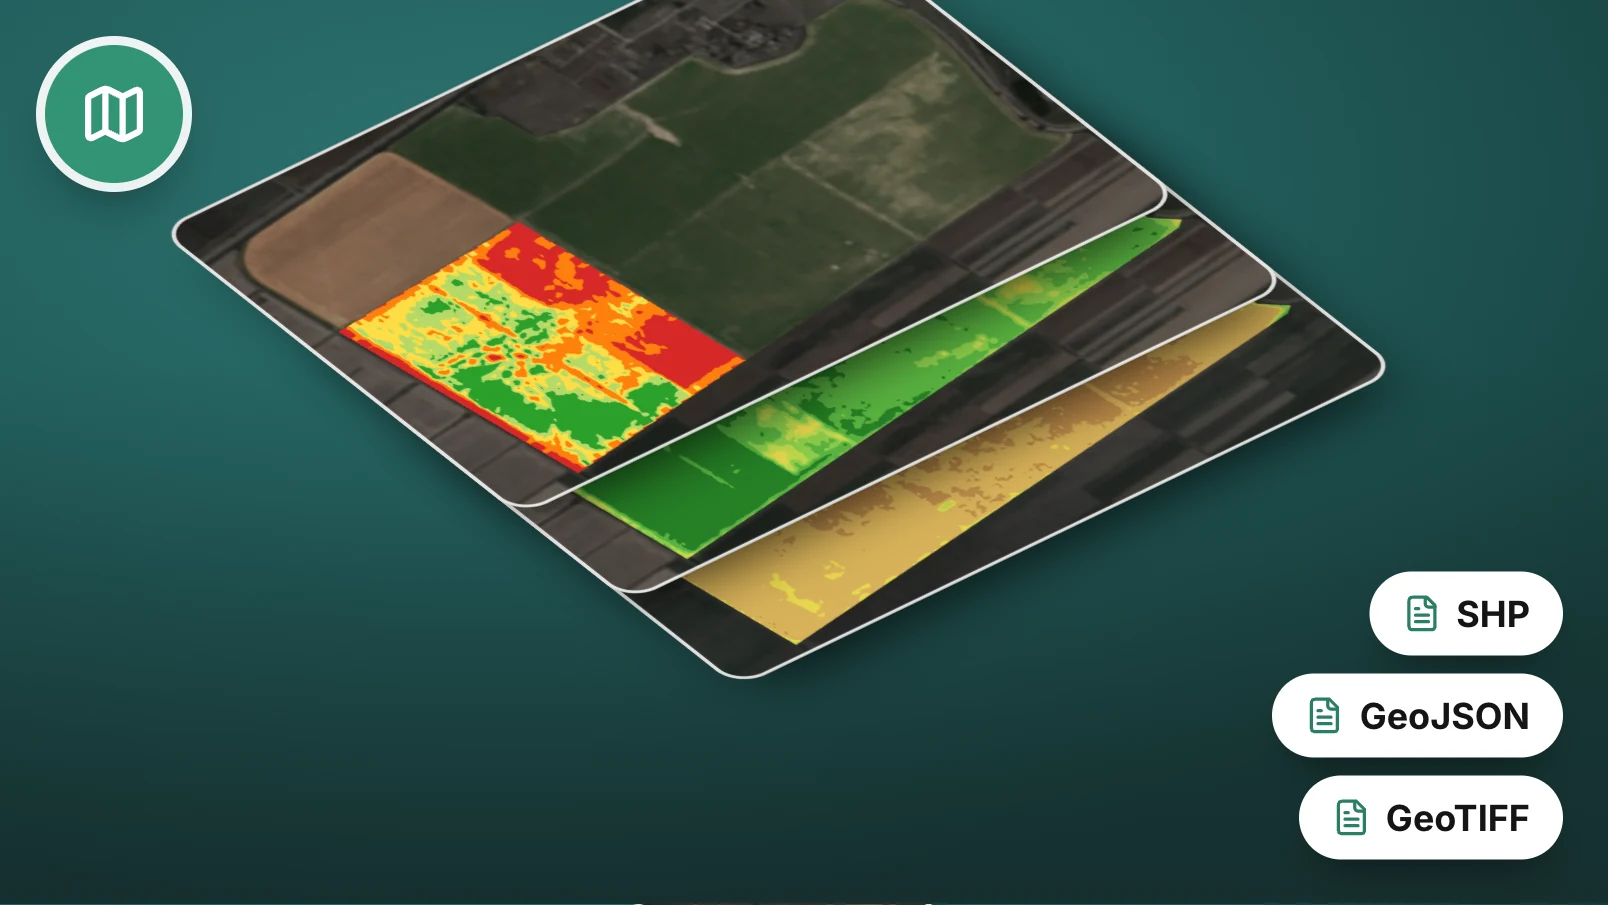
GIS & Remote Sensing Services
Custom mapping, field digitization, yield estimation, loss verification.
- Field boundary digitization from aerial imagery, drone photos or GPS
- Pre-harvest yield estimation with biomass models from satellite imagery
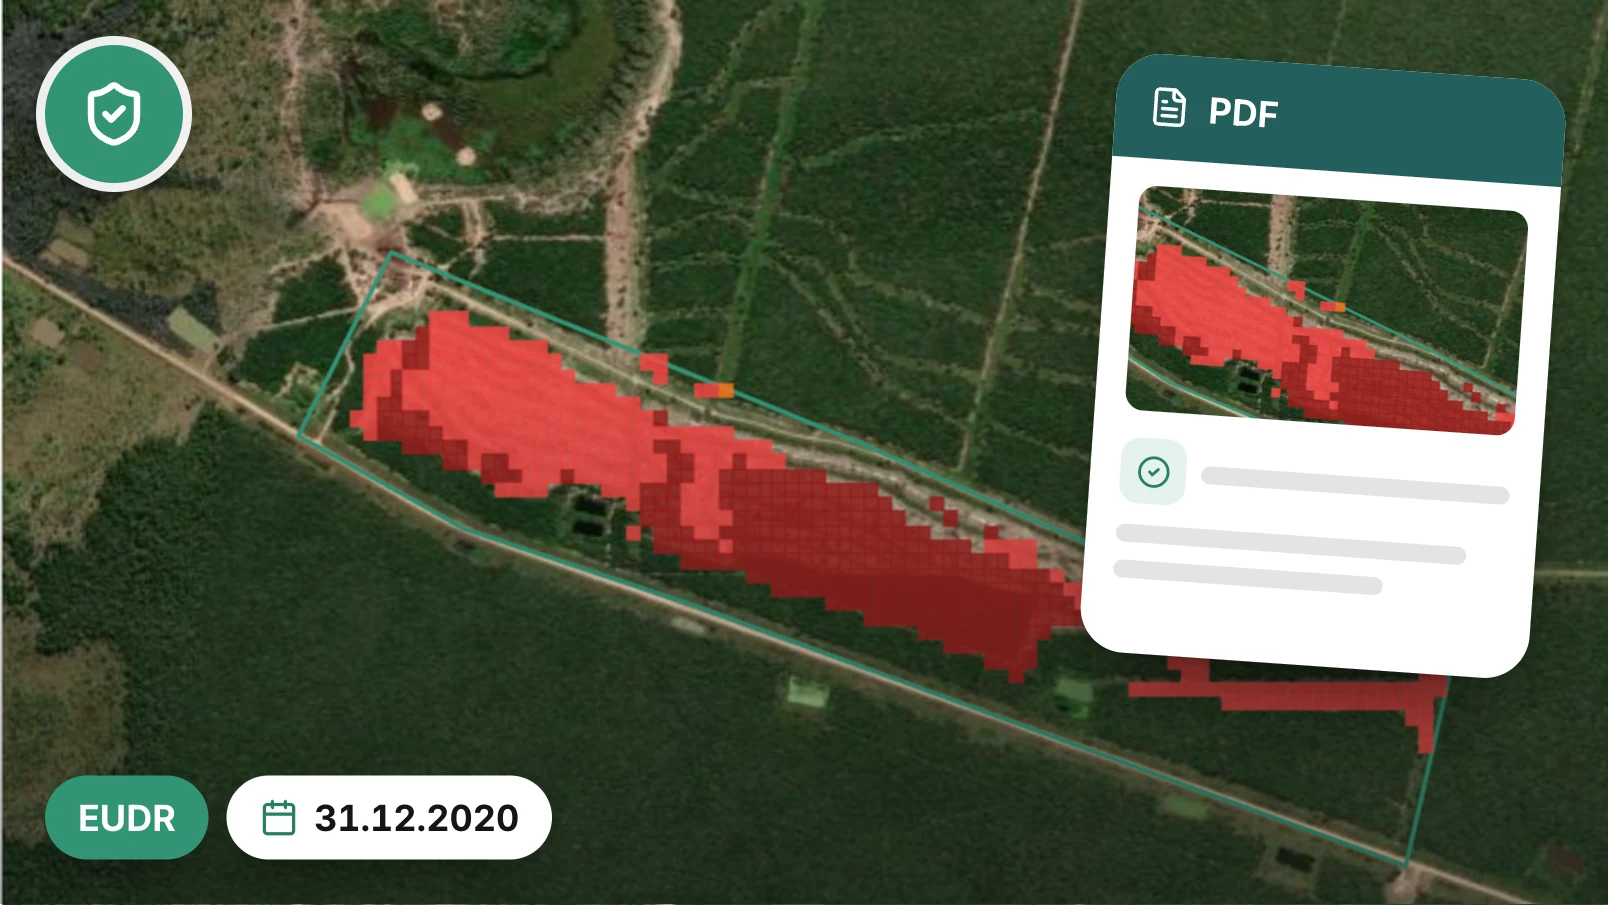
EUDR & ISCC Compliance Reports
Show that your parcels were not deforested after the cutoff: EUDR and ISCC evidence, parcel by parcel, in one PDF report.
- EUDR + ISCC in one workflow — choose the regime per report
- Global forest-change baseline for deforestation
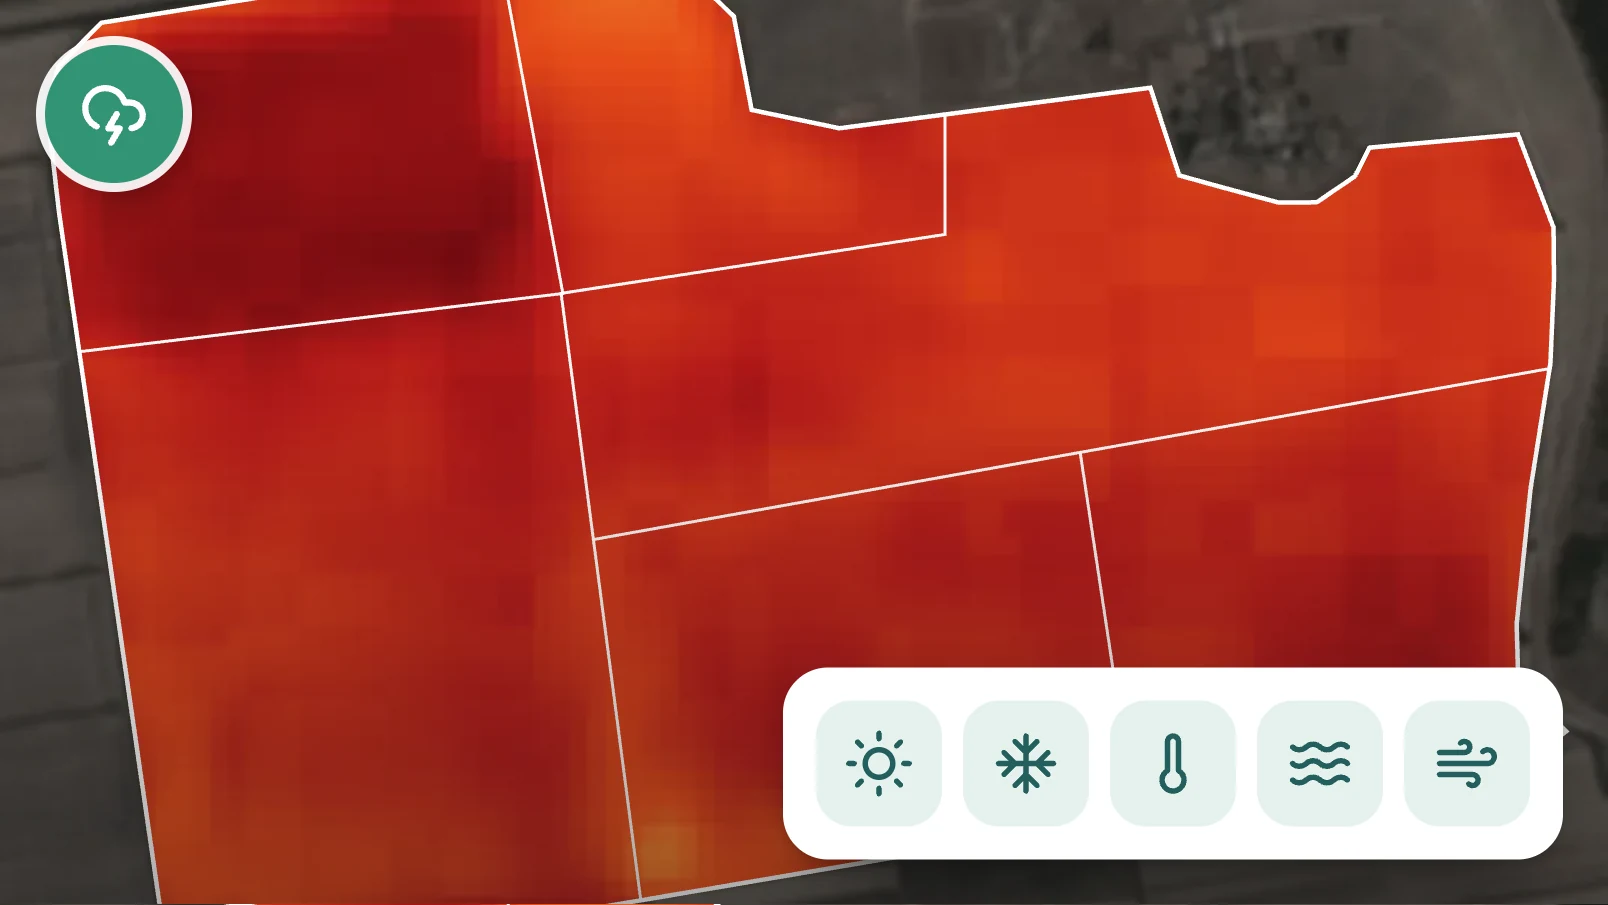
Climate Risk Analysis
Flood risk, drought stress and extreme-weather analysis for farms, lenders and insurers.
- Flood-risk mapping (historical events + projections)
- Drought-stress analysis (NDMI, NDVI multi-year)
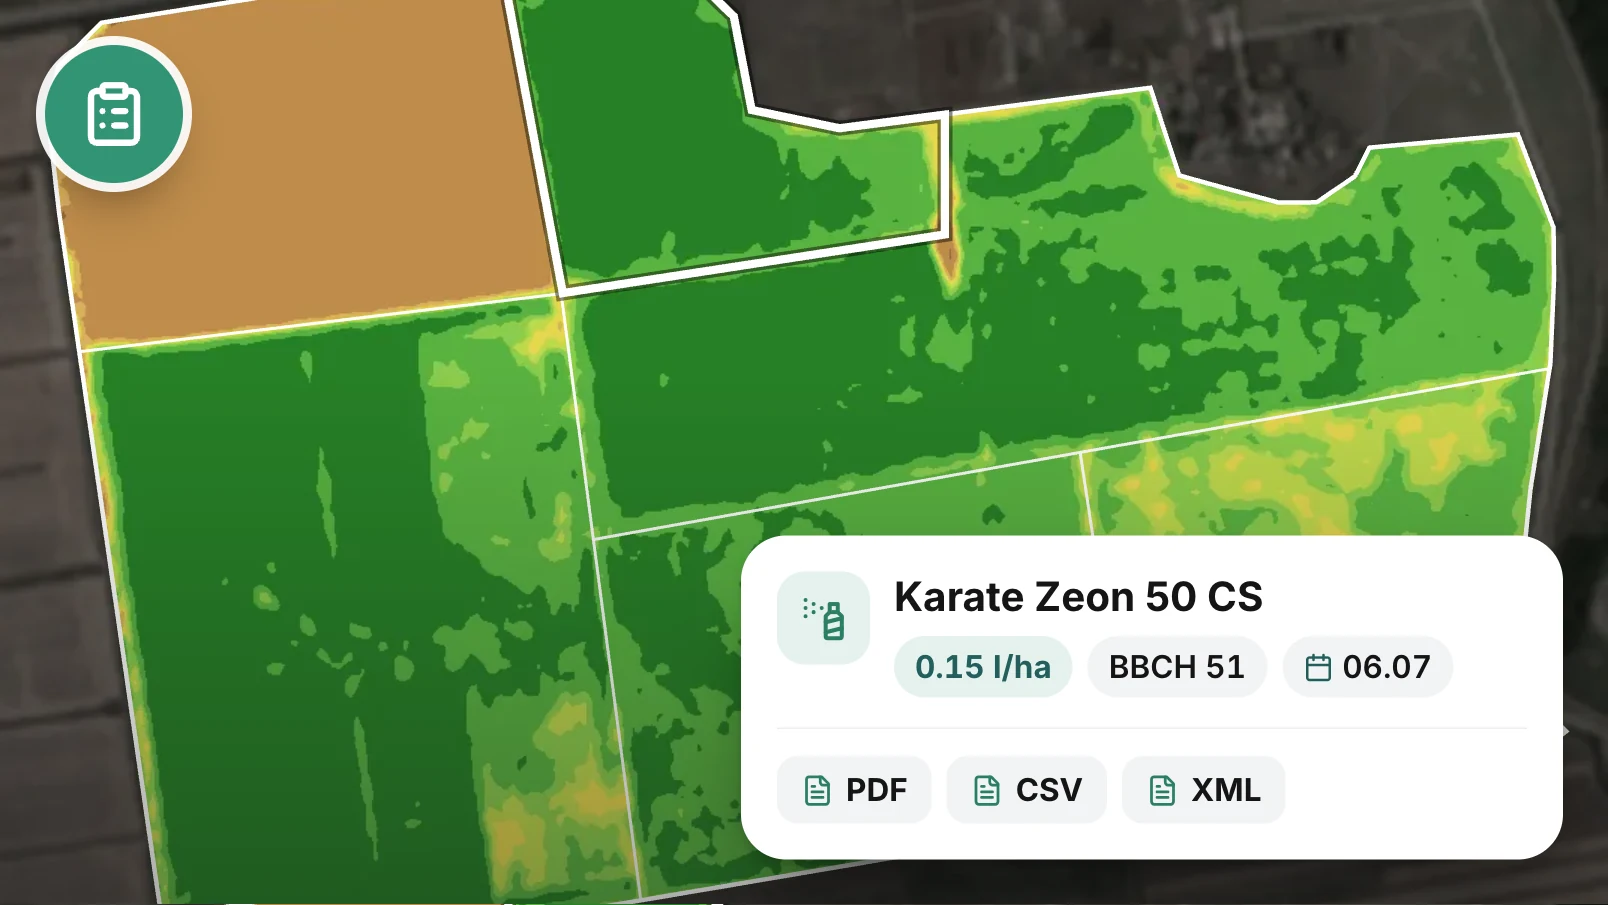
Spray register
Record every plant-protection treatment on the parcel it was applied to, and export the register as CSV, XML or PDF.
- One line per product applied — a tank mix of three products is three lines
- Your own product catalogue: authorisation number, active substance, default dose and pre-harvest interval
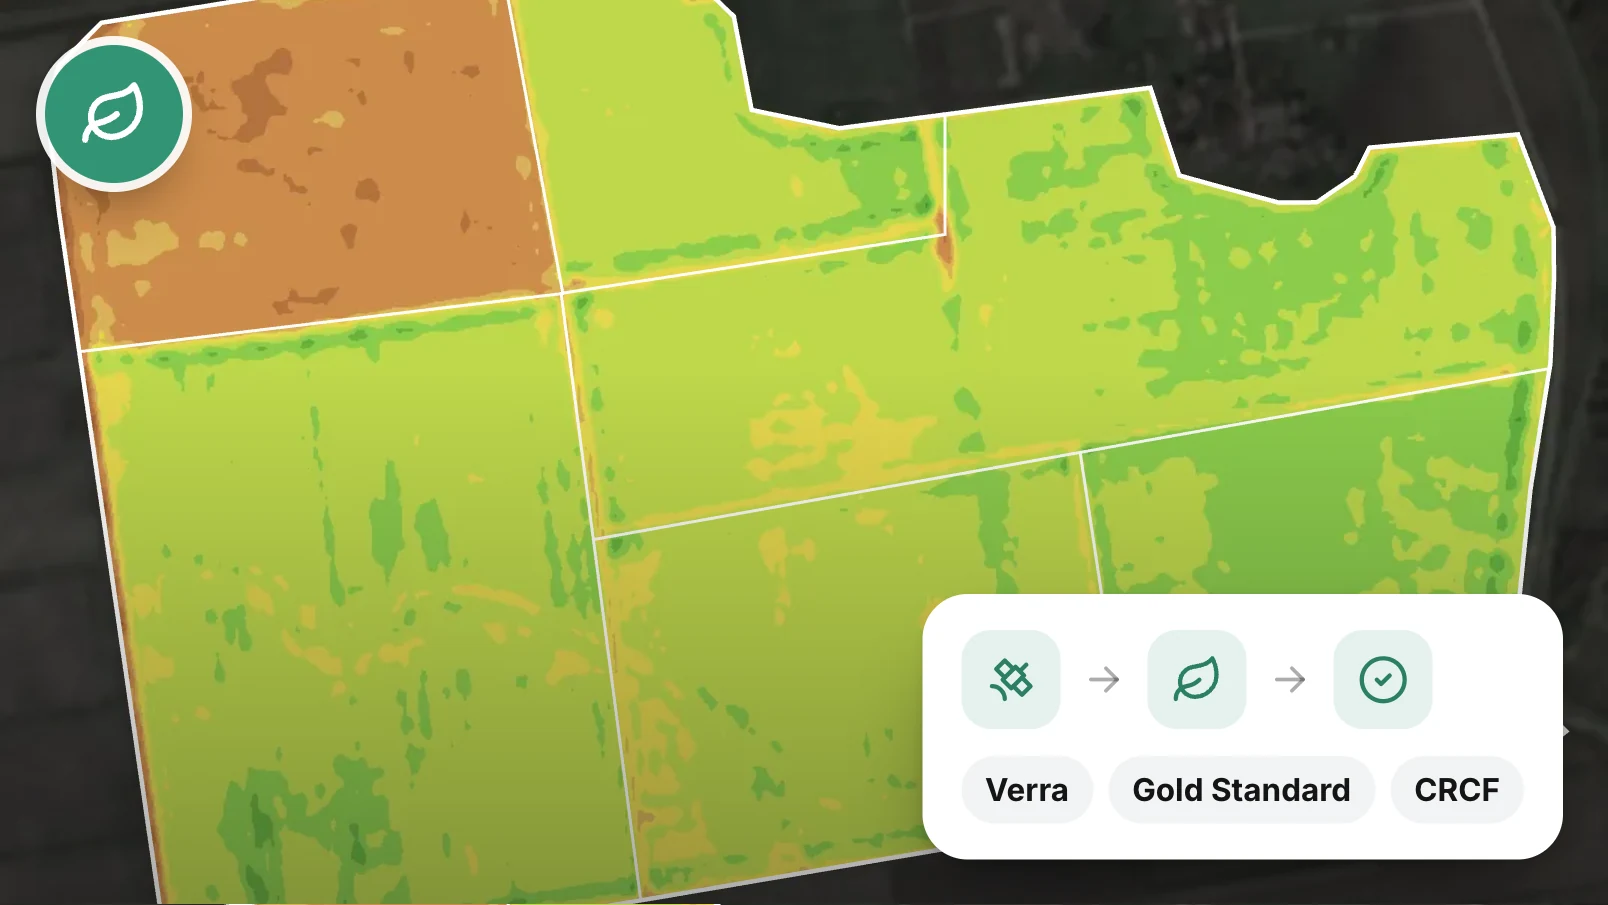
Agriculture Carbon Projects
Carbon project feasibility, baseline analysis and satellite-based MRV — delivered with Creative Carbon and Midori Earth.
- Feasibility assessment with multi-year historical satellite analysis
- Baseline establishment for Verra VM0042, Gold Standard SOC, EU CRCF
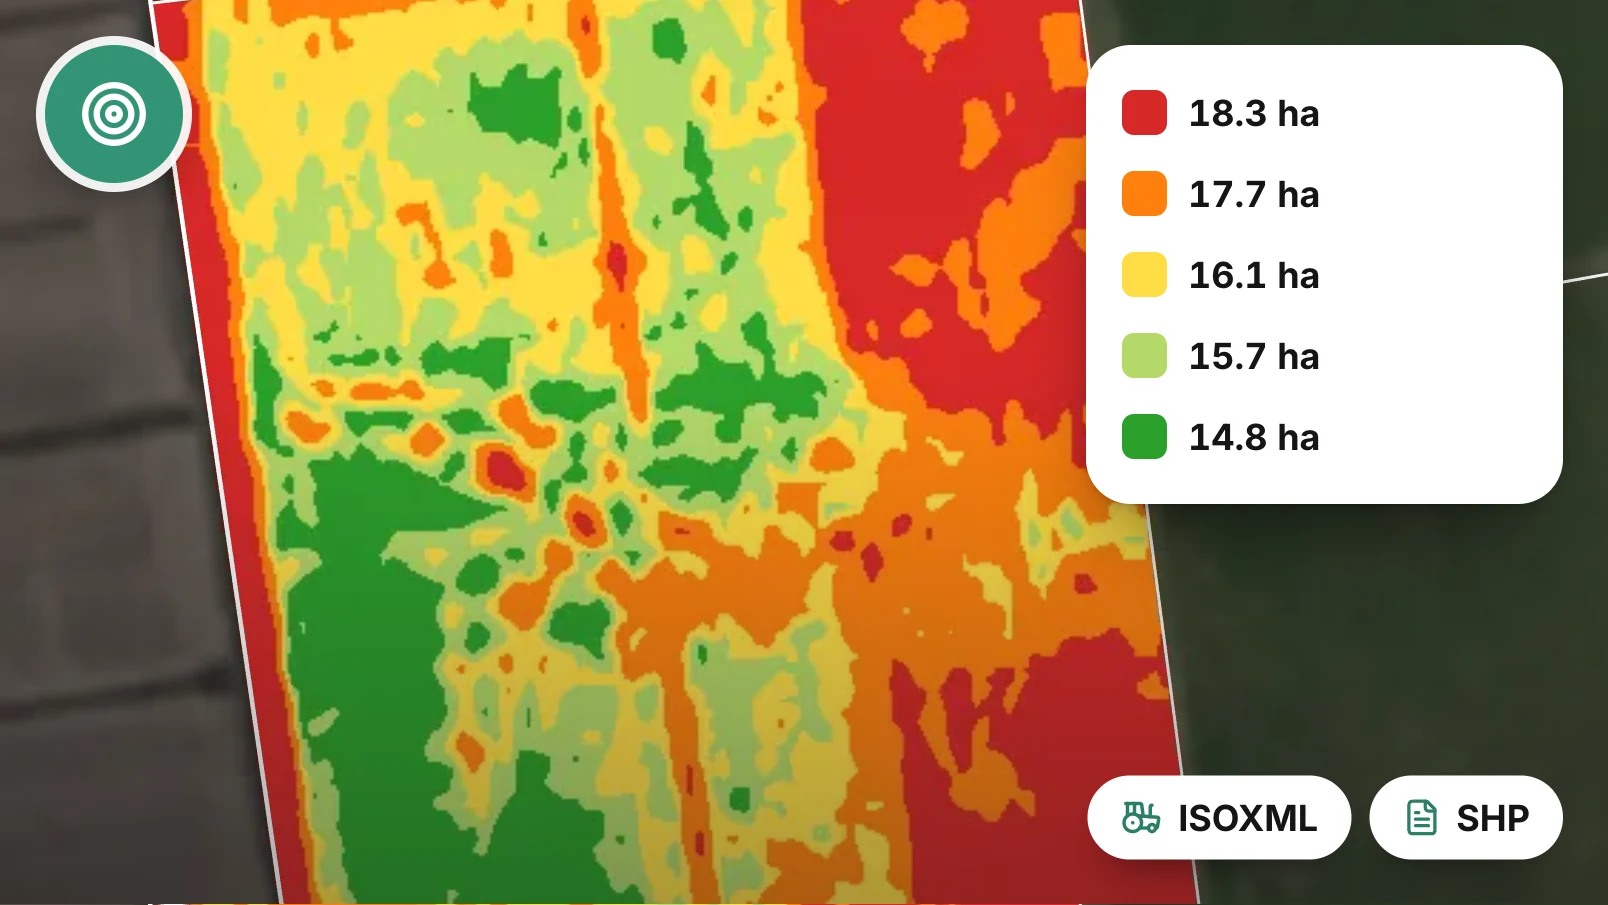
Variable Rate Prescription Maps
Convert satellite indices into machine-ready VRA maps for sprayers, spreaders and seeders.
- Zoning from any supported satellite index histogram
- Configurable zones (3–7 management zones)
Four steps, and none of them need a technician.
The same path underneath every solution on this page.
We are not trying to be every farm tool.

Not sure where to start?
Send us a short brief and a consultant will recommend the right combination for your crop and acreage. We reply within one business day.